
Horror’s Stephen King might not have been a product manager, but he may have done well in such a role. You see, King followed an invaluable rule in reviewing and editing pieces in his prolific body of work to make them better for the end reader: “Kill your darlings, kill your darlings, even when it breaks your egocentric little scribbler’s heart, kill your darlings.”
In a B2B organization, products might be held near and dear internally — but what matters is who they are serving and how they are performing externally. In these times of market uncertainty, being efficient with your resources is even more important. And often that means taking a good hard look at your product portfolio and picking out the weakest links, the hidden errors, the extraneous bits and pieces.
Use the upcoming annual planning cycle to take a critical look at the performance of your product portfolio. With the Mereo Portfolio Performance Analysis Chart, you can map out your high performers and single out those low enough to consider shifting product approaches or killing your product darling altogether.
PUT YOUR PRODUCTS THROUGH THE TEST
Use the Mereo Portfolio Performance Analysis Chart to objectively analyze your products.
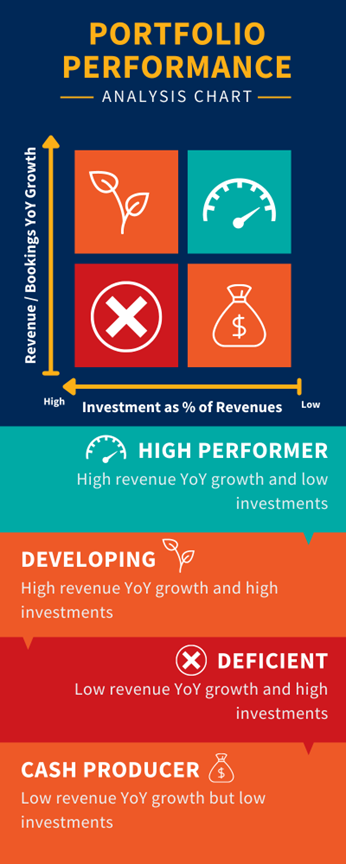
1) Plot your products on the Portfolio Performance Analysis Chart.
There are two metrics to gather to place your products within their appropriate quadrants. First, you will want to know how much year-over-year revenue or bookings growth the product delivered. Second, you should figure the investment cost as a percent of the overall revenue. Then see how the products fall. Are they high, medium or low investments? Is the product contributing to revenue growth? Your organization will do well to have most of its products in the high performer quadrant. Yet products dangling elsewhere on the chart are not immediate signals that they need to be stomped like a cockroach. Analyze all sides of your portfolio and its future first.
2) Identify opportunities for shifting the product to a higher value or efficiency.
Once you have a visual of your products, focus on those sitting in the orange quadrants. What products are developing, meaning they currently demand high investment costs but they also are helping your organization grow? These offer an opportunity to your team to figure out how to create, deliver or repackage the product in order to reduce its costs and deficiencies. Then, which products have low investments costs and yet they also have low revenue returns? Where these are sitting is okay; it is not depleting your resources but it is also not a cash cow. So this offers yet another opportunity to shift your product upwards by exploring ways to grow its revenues without increasing its investment.
Products sitting in the red deficient quadrant need most of your attention. Explore options to decrease your organization’s investment costs in these products while and / or to increase its revenues.
3) Know when to retire products that are forever trapped in the “Deficient” quadrant.
If you cannot solve how to decrease the costs associated with a deficient product or to increase its revenues, then it might be time to cut the cord. It might be hard to step back and objectively say, “Should we be doing this still?” But with the Portfolio Performance Analysis Chart, products that drain your resources and take away your time and money from more viable products become clearer.
COMMIT TO SUSTAINABLE REVENUE PERFORMANCE
Your product portfolio should drive sustainable revenue performance. So if a part of your overall portfolio is draining resources and holding your overall performance back, it may be time to make the hard call to kill your product darling.
For more solution management guidance, turn to The Expert Guide to Elevating Revenue Performance with Solution Management — a guidebook, workbook and resource for product managers and marketers alike.